


Interface overview
A tour of the Bonita Process Designer interface: signing in, the home page with its folders and Tree view, the diagram editor, and the admin panel.
This page introduces the main screens of Bonita Process Designer so you can find your way around before you start working. For hands-on steps, see Create your first diagram and Generate a diagram with AI.
In Bonita Process Designer, "diagram" and "process" mean the same thing.
Signing in
Bonita Process Designer is a web application: you open it in your browser and sign in with a username and password. Select Remember me for 30 days to stay signed in on this browser. When an Admin has enabled self-registration, a Create account link lets you create your own account.
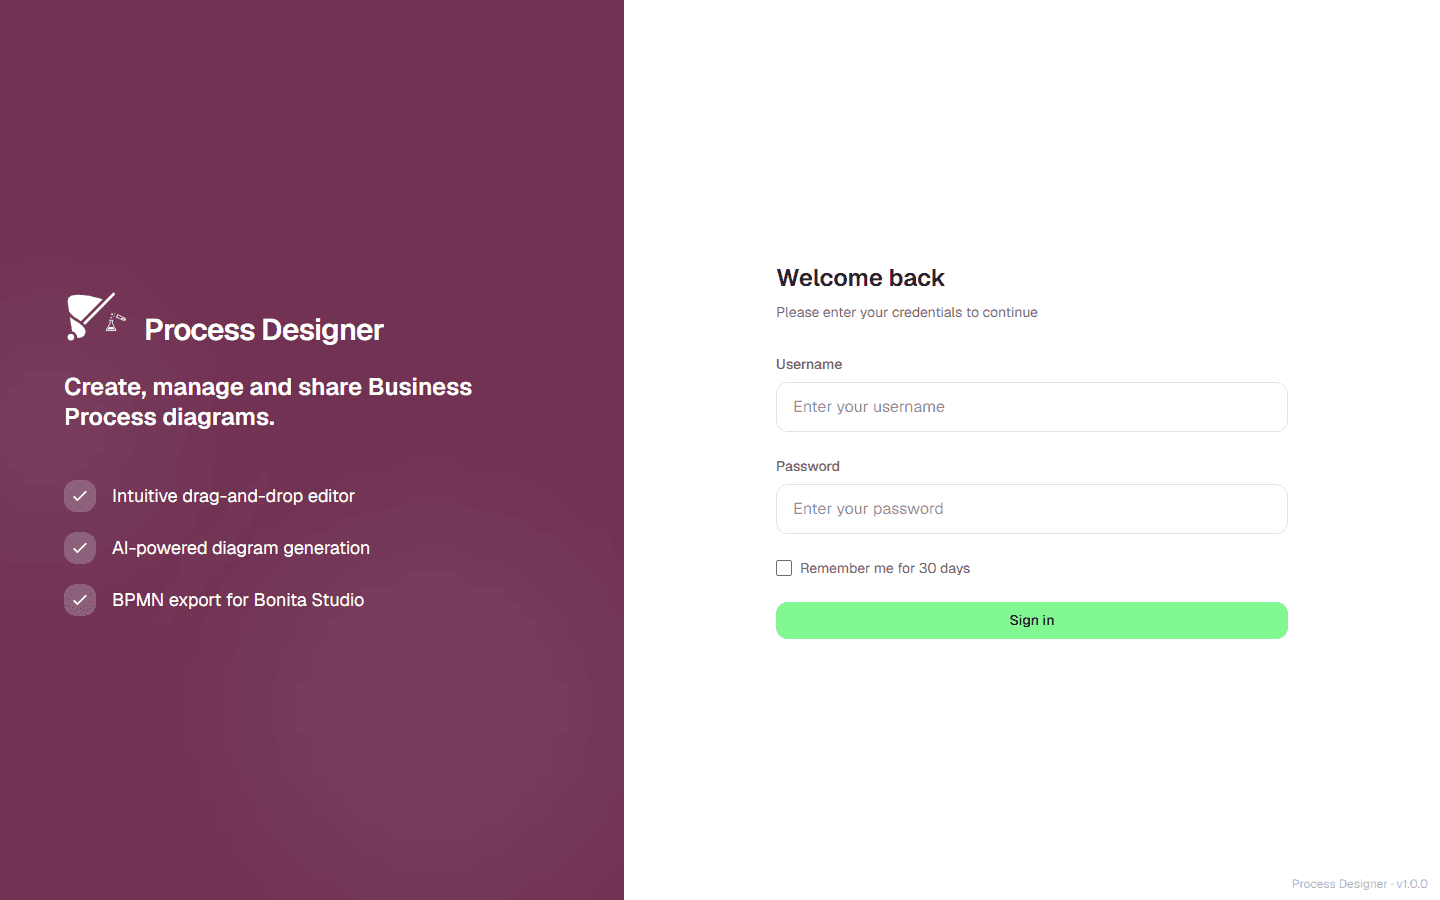
After you sign in, you land on the home page. What you then see and can do depends on your role (Reader, Creator, or Admin) and on the groups you belong to; see Roles and permissions.
-
The first time you sign in with an account an Admin created for you, you may be asked to change your password before you continue.
-
While the installation has no valid license, every user is sent to the license page instead: an Admin can install the license there, the other users see License Not Active. See Manage the license.
-
When Bonita Process Designer runs alongside a Bonita Runtime, it has no sign-in form: you sign in to the Bonita portal. See Run with Bonita Runtime.
The header
The header at the top of the home page and of the editor holds:
-
Home, which takes you back to the top level of the home page;
-
Admin, which opens the admin panel. Only Admins see it;
-
in the editor, the filing path of the open process;
-
the search field, which searches diagrams by title or description. From the editor, a search opens the home page with the results;
-
your user menu, with your name: it shows your role, and lets you change your display name, your avatar and the language of the interface, and sign out.
The version of Bonita Process Designer is shown in the footer, at the bottom right of every page, including the sign-in page.
The home page
The home page is your starting point. It shows one level at a time: Home, the top level, or the folder you opened. You only see the diagrams and folders of your groups; an Admin sees all of them.
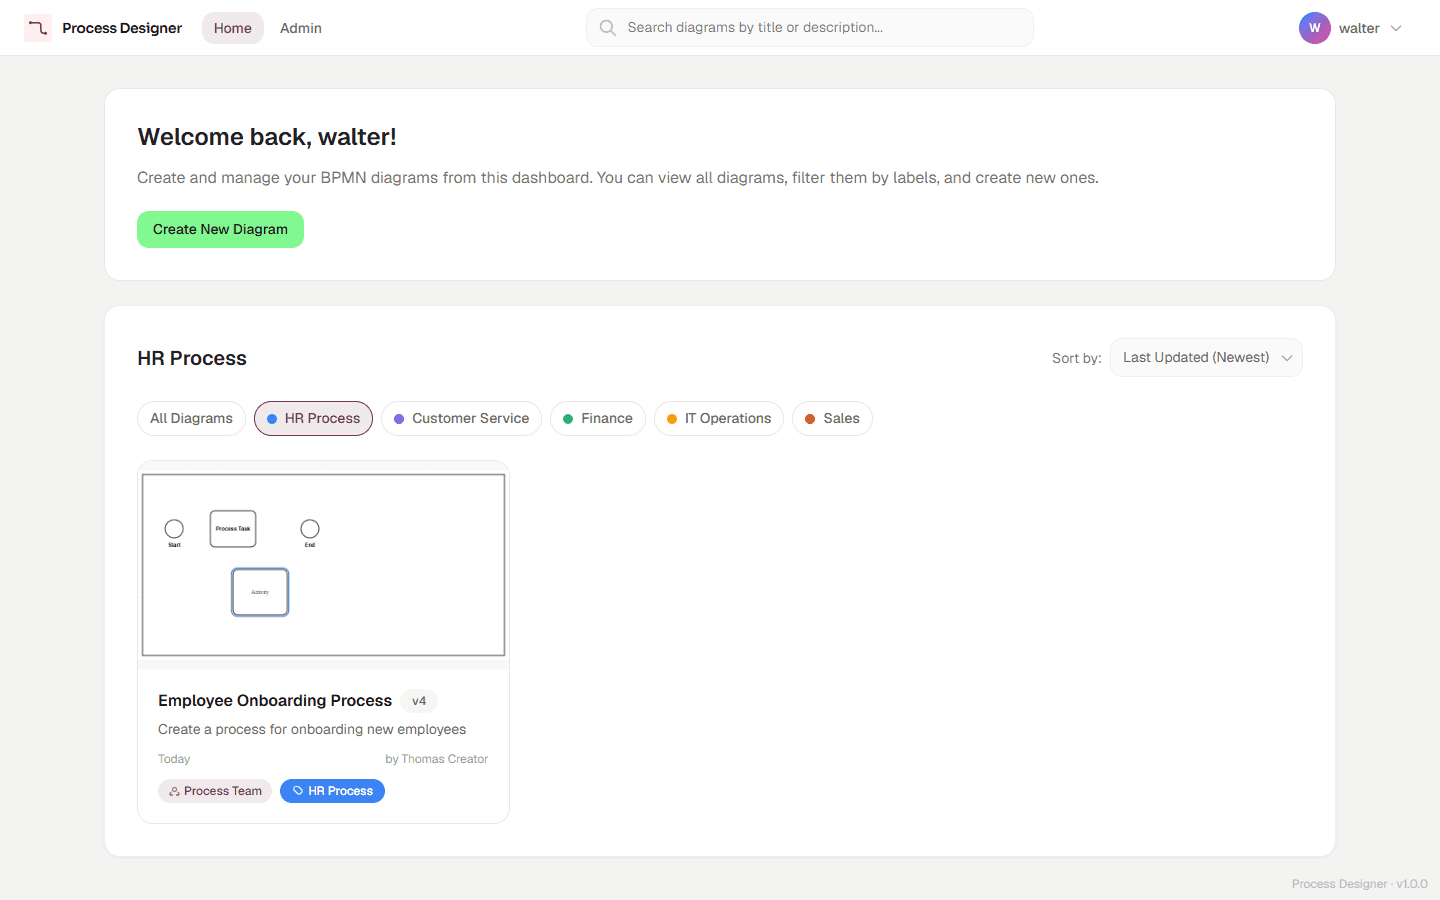
From top to bottom, the home page shows:
-
A welcome panel with Create New Diagram and New folder. Readers do not see these buttons. A Creator who belongs to no group sees them disabled, with the note "Join a group to create diagrams — ask an administrator to add you to one."
-
The breadcrumb, which starts at Home and shows where you are, for example Home / Finance. Select a segment to go back up.
-
The controls of the level:
-
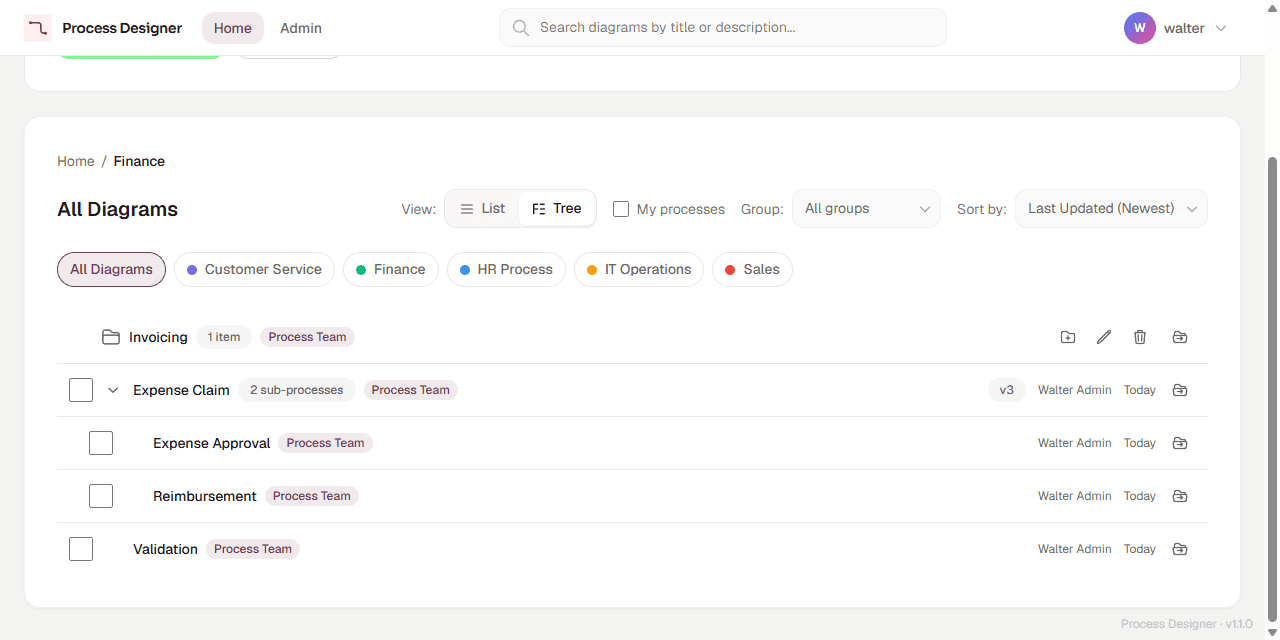
View: switches between List, with folder tiles and diagram cards, and Tree, with one row per folder or process and the processes filed under another one shown beneath it;
-
My processes shows only the processes you created;
-
Group: narrows the level to one group. It is shown when you can see two or more groups; an Admin sees every group;
-
Sort by: orders the diagram cards.
-
-
The label chips, starting with All Diagrams, which filter the diagrams by label. If an Admin has featured a label, its chip comes right after All Diagrams and is selected when the page opens. The label chips and My processes apply to the level you are on.
-
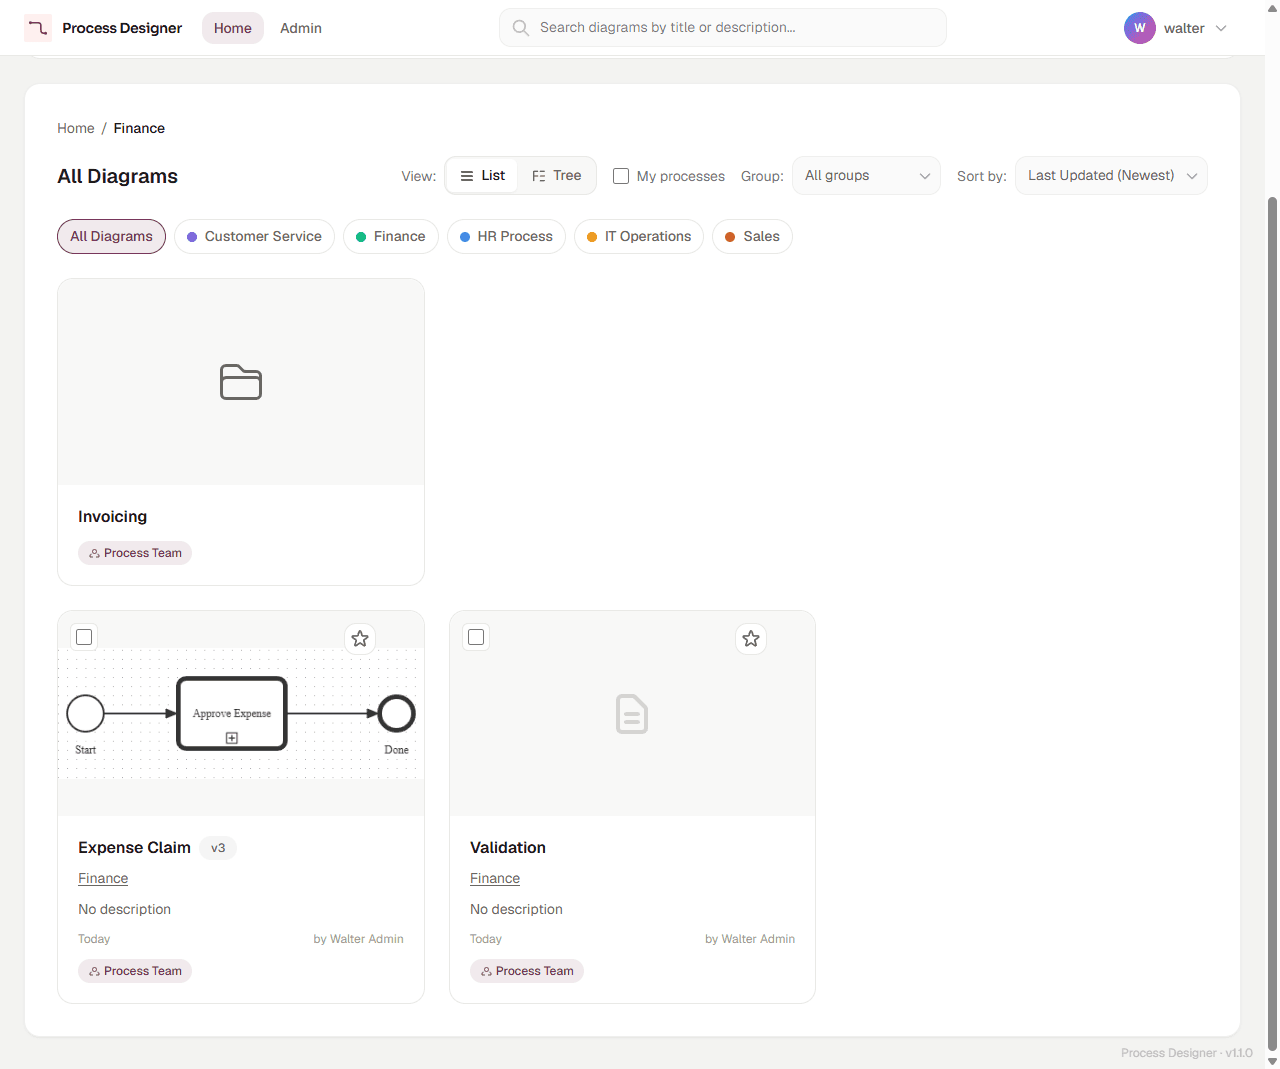
The folder tiles of the level, then the diagram cards of the diagrams filed directly in it. When the level contains favorites, the cards are split into Favorites and Other diagrams.
A diagram card shows a thumbnail of the diagram, its title and, once the diagram has been saved, its current version number (for example v3), its filing path when it is in a folder or under another process, an excerpt of its description, the date of its last update, its author, its group and its labels. Each segment of the filing path can be selected. The star adds the diagram to your favorites. Creators and Admins also see a checkbox, used to select several diagrams and move them together. The card’s menu, the three dots, offers Open, Edit labels, Move to… and Delete; Readers only see Open.
A folder tile shows the folder’s name and group. Select it to open the folder. For Creators and Admins, its menu offers New folder in "Name", Rename folder "Name", Move to… and Delete folder "Name".
In the Tree view, a level is shown as rows, here the Finance folder:
While a search is active, a list of results replaces the level: each result shows its filing path, followed by its title.
To go further:
-
Manage diagrams — create, find, open and delete diagrams, and the details of cards, search, filters and sorting;
-
Organize processes in folders — folders, the filing path, and moving processes;
-
Browse the process tree — the Tree view and its keyboard reference.
The diagram editor
Opening a diagram takes you to the editor, where you build and modify your BPMN diagram. Creators and Admins open it with full editing rights. Readers open it in view-only mode, shown by a Read-Only Mode banner.
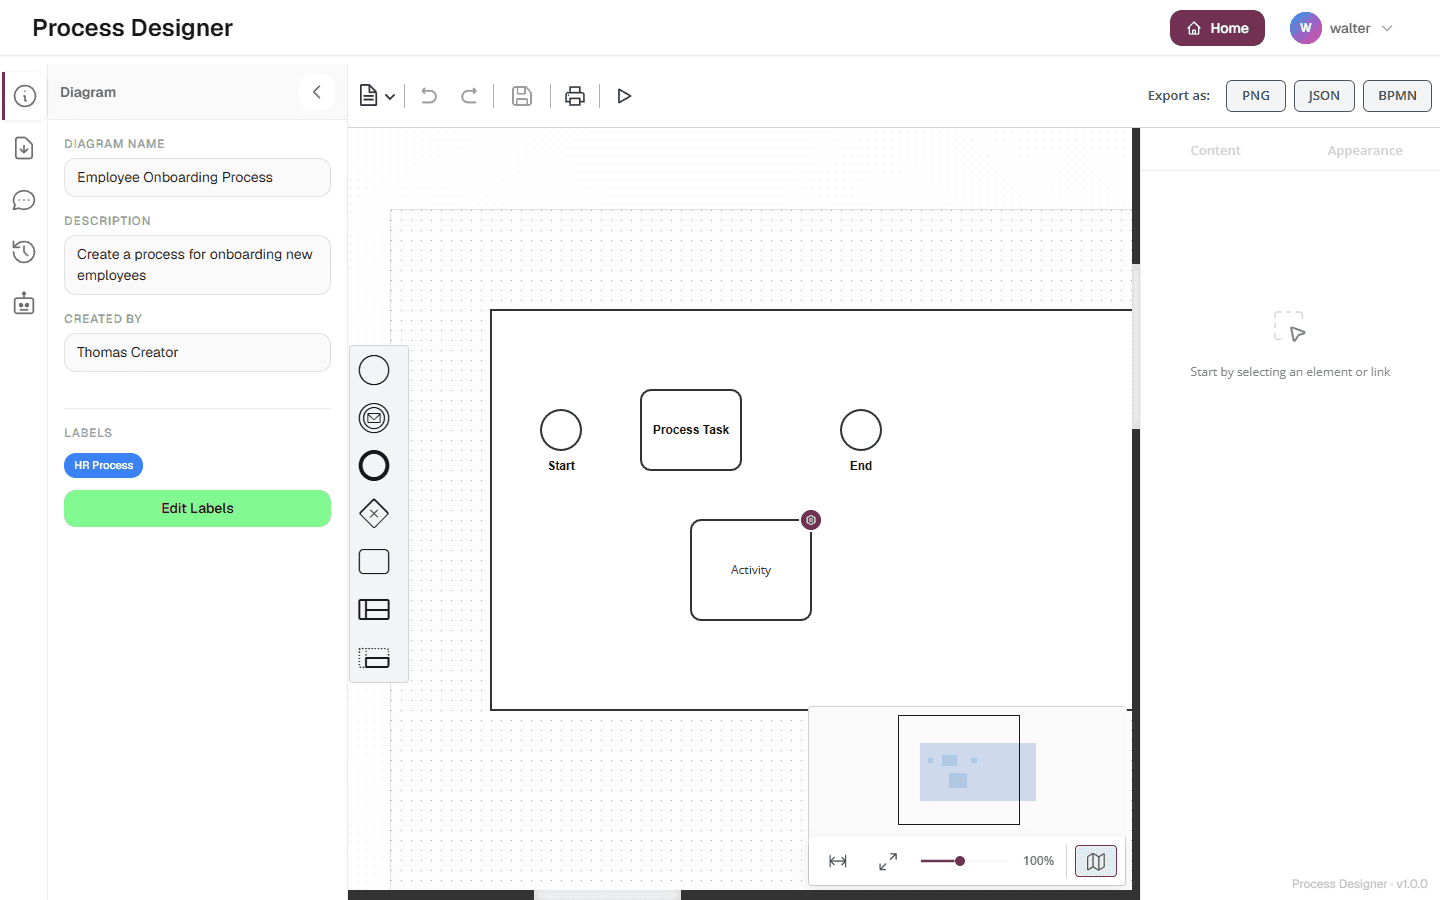
- Header
-
Next to Home and Admin, the header shows the filing path of the open process, for example Finance / Expense Claim. A process in the path can be selected to open it; a folder is plain text. See The process path in the editor header.
- Document tabs
-
When you open a called process from a Call Activity, it opens in a document tab inside the application, and a tab strip appears above the editor. Each tab keeps its own zoom, selection, undo history and unsaved changes, and shows the path of its process under the strip. See Work with document tabs.
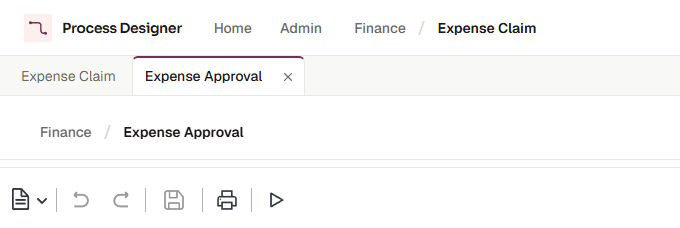
- Toolbar
-
On the left: Open file, to import a file into the diagram, Undo and Redo, Save diagram, Print, and Simulate process (Stop simulation while a simulation runs). On the right, after Export as:, the PNG, JSON, BPMN and BPMN+ buttons. BPMN+ exports the process together with the processes filed under it, as one file. Readers do not see Open file, Undo, Redo and Save diagram. See Save your work and Export and import diagrams.
- Side panels
-
The narrow bar on the far left opens a panel: Diagram (the diagram’s name, description, author and labels, with Edit Labels), Import Logs (what an import converted, removed or could not import), Comments, Versions, and the AI panel. Readers do not see the Import Logs tab and the AI panel. See Comment on diagrams, Version your diagrams and AI diagram generation.
- Palette
-
The palette floats on the left edge of the canvas. It offers one shape per BPMN category: start, intermediate and end events, a gateway, a task, a pool and a swimlane. Drag a shape onto the canvas, then choose its exact type in the inspector. Readers do not see the palette. See Supported BPMN elements.
- Canvas
-
The central work area where your diagram is drawn. Pan by dragging an empty area of the canvas, or by scrolling.
- Inspector
-
The panel on the right shows the properties of the selected element, in two tabs, Content and Appearance. With nothing selected, it reads Start by selecting an element or link. When a Call Activity is selected, its Called process section lets you choose the process it calls. Readers do not see the inspector. See Edit a diagram and Call other processes.
- Zoom and minimap
-
In the bottom-right corner of the canvas: Fit to screen, Toggle full screen, the Slide to zoom slider with the current zoom level, and a button that shows or hides the minimap above them.
- Collaboration
-
When several people open the same diagram, you see who else is present and their live cursors, and edits are shared in real time. While someone else’s AI request changes the diagram, a banner tells you that editing is paused until it finishes. See Collaborate in real time.
|
You can also generate a complete diagram from a plain-language description instead of drawing it by hand. See Generate a diagram with AI. |
The admin panel
Admins open the admin panel with Admin in the header. Readers and Creators do not see the link, and the panel refuses them.
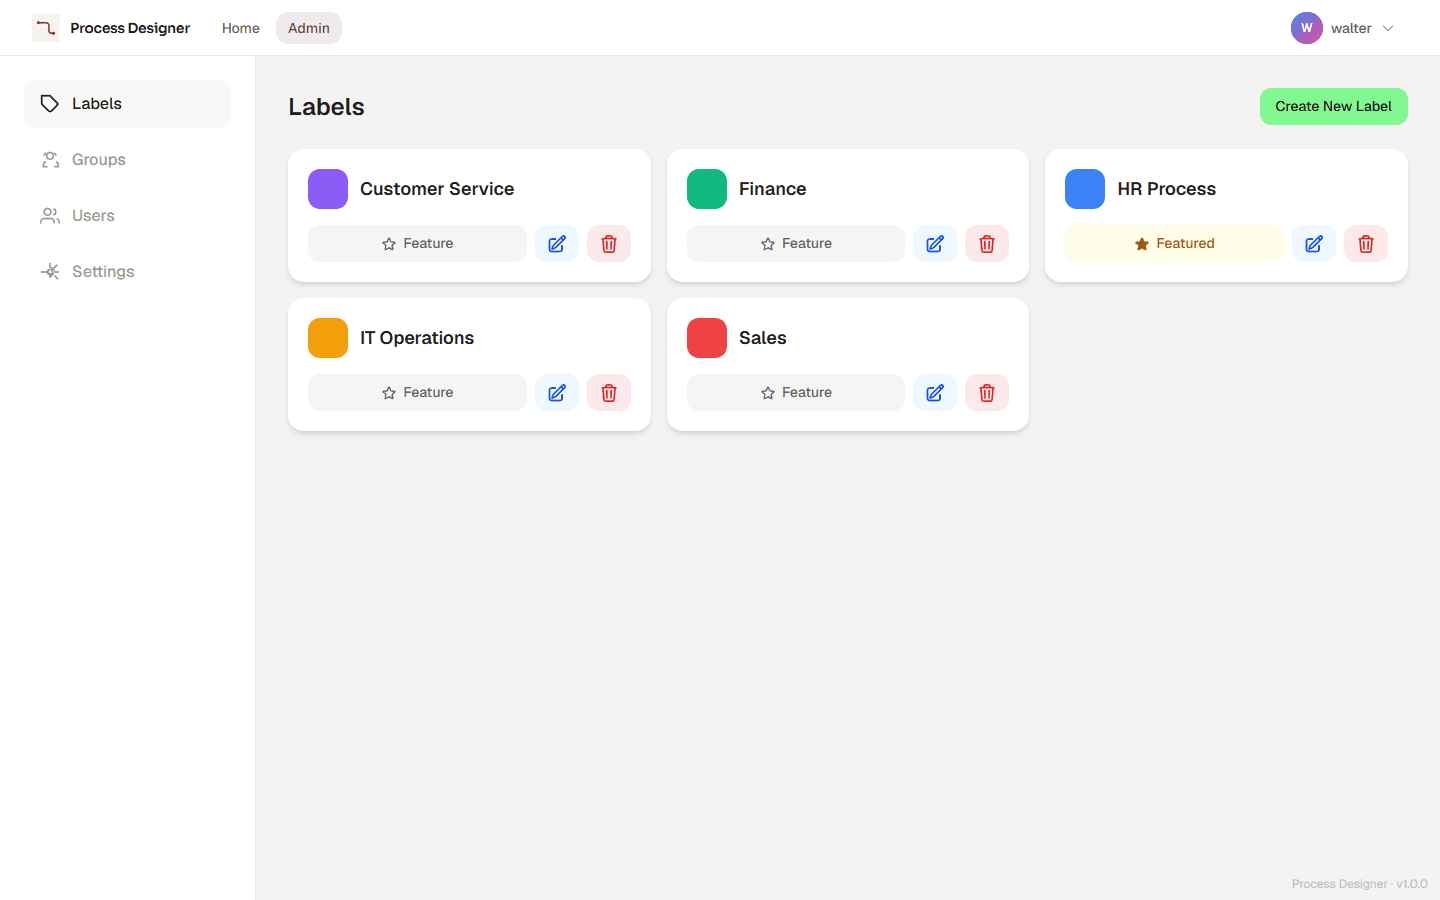
The panel has five tabs:
-
Labels — the catalog of labels, shared by all groups. See Manage labels.
-
Groups — groups, their members and their AI quota. See Manage groups and Manage AI quota.
-
Users — accounts and roles. See Manage users.
-
Settings — user registration, editor settings, product analytics, and the AI configuration, with the Installation ID. See Application settings.
-
Support — the Download diagnostic archive button, which collects in one ZIP file what the Support team needs to diagnose your instance. See Download a diagnostic archive.
The license has its own page. See Manage the license and, for an overview of every administration task, Administration.